
AP Students
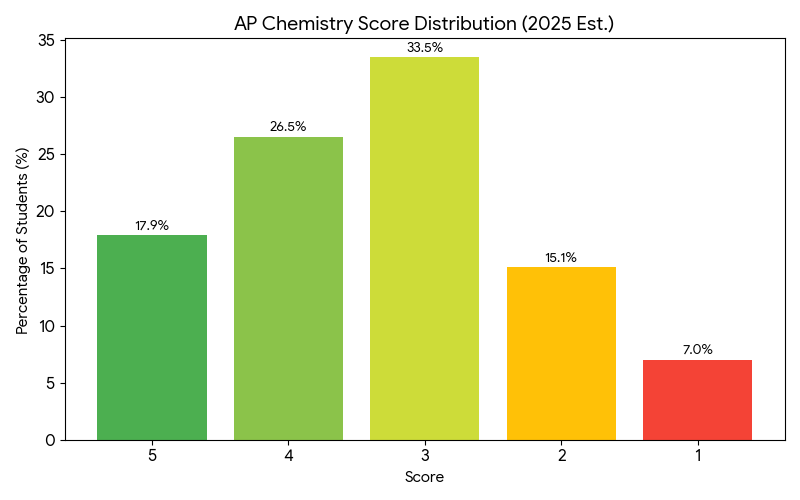
While approximately 77.9% of students pass (score 3 or higher), only a small fraction (17.9%) reach the highest mastery level. This visualization helps parents see that while passing is common, achieving a "top score" for competitive college credit requires specialized help.
College Students
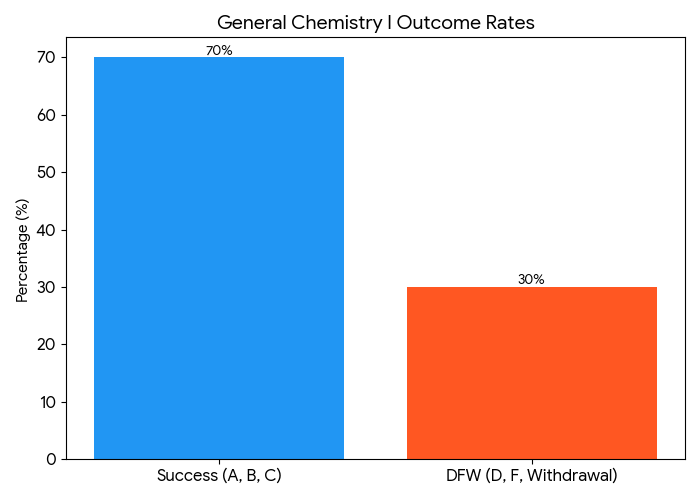
In university settings, General Chemistry is often a "gatekeeper" course. This chart reflects a representative national trend where roughly 30% of students fall into the DFW (D grade, F grade, or Withdrawal) category. Highlighting this risk is a powerful motivator for students to seek tutoring early in the semester rather than waiting until they are in trouble.
Pre-med Students
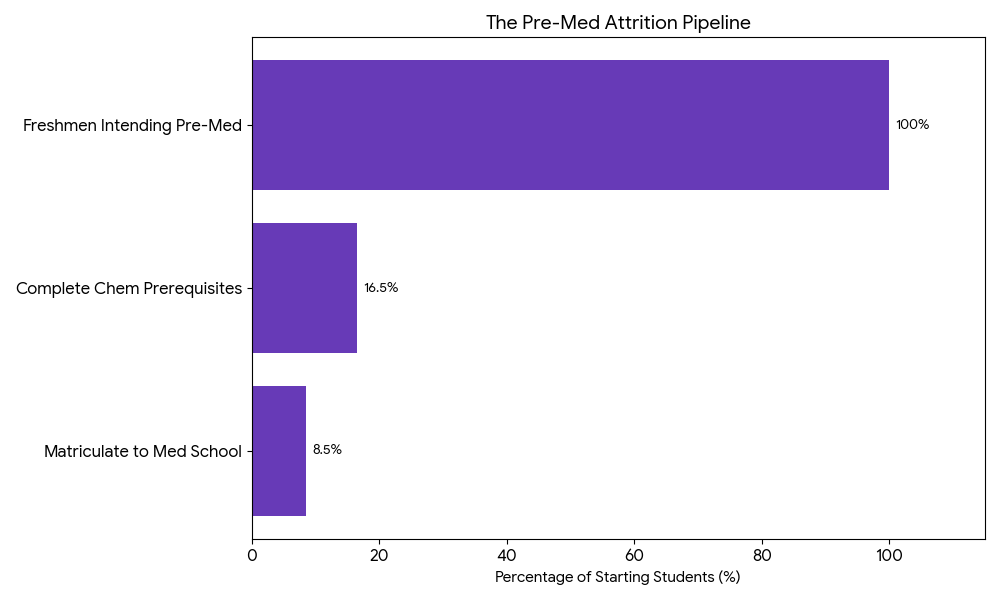
This chart illustrates the "leaky pipeline" effect in medical education.
100%: Many students start as "Pre-Med" freshmen.
16.5%: Only a small portion successfully complete the rigorous chemistry prerequisites.
8.5%: An even smaller percentage ultimately matriculate into medical school. This visual is particularly effective for marketing to pre-med students, positioning your tutoring as the essential tool to keep them in that top 8-16%.